Run First Flow
Video
Guide
Tutorial 02 (S01–S07): Run Your First IC Design Flow with Terminux AI
Same Terminal. Same Habits. · Every Terminal Action. AI-Aware.
What you will do
- Start Terminux and use it like any terminal.
- Ask AI where the GCD design files are, then check them yourself.
- Run the GCD flow, and find its receipt and Run ID.
- Bind that run, ask AI which quality checks need attention, then verify the answer in the DQE Viewer and the Report.
- Ask AI what to inspect next.
Lesson video: English (07:15.4) / 繁體中文 (07:14.0). Timecodes below are for the English video, with the 繁體中文 video in brackets.
Before we begin: where these EDA tools fit
This tutorial uses an open-source RTL-to-GDS flow as a practical example. You do not need to know the Yosys or OpenROAD command language to follow it, but knowing their roles makes the output meaningful. The commercial EDA products below are stage/function analogies, not interchangeable executables or claims of equivalent signoff capability.
The big picture: GCD RTL → Yosys (synthesis) → OpenROAD (physical implementation) → KLayout (GDS finishing / merge) → GDS. ORFS orchestrates this flow. Terminux is the terminal, run-evidence, DQE and AI-assisted workflow around it—not another EDA stage after GDS.
| Tool / term | What it does in this lesson | Familiar commercial-flow reference |
|---|---|---|
| ORFS — OpenROAD Flow Scripts | Flow scripts, not a single synthesis or place-and-route engine. Connects the RTL-to-GDS stages so one command can run the GCD example. | Comparable to a project’s automated RTL-to-GDS implementation flow/scripts, not to one licensed product. |
| Yosys | Open-source logic synthesis: transforms synthesizable RTL into a gate-level netlist using target libraries. | Cadence Genus; Synopsys Design Compiler. |
| OpenROAD | Open-source physical implementation: floorplan, placement, clock-tree synthesis (CTS), timing optimization, and routing. | The implementation role of Cadence Innovus and Synopsys IC Compiler II. |
| OpenSTA | Static timing analysis engine used in the OpenROAD ecosystem; helps interpret setup/hold timing, slack, WNS, etc. It is not a separate command the learner needs to run here. | The STA role of Cadence Tempus or Synopsys PrimeTime; not a claim of signoff equivalence. |
| KLayout | In this recorded ORFS run, KLayout 0.28.16 merged GDS data to produce 6_final.gds. KLayout can also view and analyze layouts, but the video does not open a layout viewer. |
Think GDS output and layout viewing/verification activities in a commercial flow; no single one-to-one product equivalent. |
| Terminux + DQE Viewer | The user-facing terminal, run/evidence and AI-assisted quality inspection shown in this tutorial. Not a replacement synthesis, P&R, or signoff engine. | A workflow and analysis layer around your EDA flow, rather than an alternative to Genus or Innovus. |
Integrated commercial platforms: Cadence Innovus+ and Synopsys Fusion Compiler span synthesis and implementation. They are deliberately not listed as a one-stage equivalent for either Yosys or OpenROAD. These comparisons identify workflow stages, not identical features or signoff quality.
The example GCD is the sample RTL design; Nangate45 is the reference technology/platform used for this run. Neither is an EDA tool. The flow uses an SDC timing constraint; the tutorial checks the SDC_FILE path reference, not the constraint's timing correctness. Later, it examines actual DQE FAIL/WARN results. A completed flow (exit 0) does not mean the design has passed timing or signoff.
What to recognize when you run Step 12: --yosys-exe selects the synthesis tool, while --openroad-exe selects the physical-design tool. terminux-orfs-run invokes the configured flow and records this run's evidence; you will inspect its results in the later steps.
Official references: OpenROAD Flow user guide, Yosys, OpenROAD, Cadence Genus, Synopsys Design Compiler, Cadence Innovus+, Cadence Innovus training, Synopsys Fusion Compiler, Synopsys IC Compiler II, OpenSTA, KLayout.
- Video: toolchain intro at 00:48.9–01:35.9 [00:49.4–01:32.9]: ORFS 00:49.3 [00:49.8], Yosys 00:59.3 [00:59.3], OpenROAD 01:11.3 [01:09.3], KLayout 01:22.8 [01:19.3], Terminux 01:27.9 [01:23.9].
What you need
- Terminux installed for your account, including the DQE Viewer.
- Terminux AI enabled for your account by your administrator (a named Profile that allows run binding).
- An ORFS checkout with the GCD design, plus OpenROAD, Yosys, and KLayout available to that ORFS environment. KLayout may already be provided by the ORFS tool installation; it need not be separately installed or on the interactive shell
PATHif the configured flow can find it. - S06–S07 require a version and Profile configuration that can pass the bound Run to AI. Confirm this capability before proceeding.
The appendix lists the status of each item.
How to read the commands
Commands are shown exactly as they were typed in the video. Paths under /data/tut02/… belong to the demo environment used for this recording: replace them with your own ORFS and tool installation paths. Where a step also gives an Action for your machine, that version is a template you adapt; it was not typed in the video in that form.
Text after @@ goes to Terminux, not to your shell. Shell variables are not expanded there; this was tested (Step 14). In an @@ command, always use a full absolute path.
AI answers below are verbatim excerpts from the recordings. Your own answers may be worded differently; the steps show how to check the facts yourself.
S01 · Start working: launch Terminux like any terminal
Step 1: Launch Terminux in your flow directory
- Purpose: start Terminux from your usual terminal, in the directory you work in.
- Where & prerequisites: your ordinary OS terminal. Terminux is installed.
- Action:
This is the demo-environment path used in the video; replace it with your own ORFScd /data/tut02/runtime/orfs/flow terminux-launchflow/directory. - Observable result: a Terminux window opens. In the recording it opened at the default size. The video cuts the part where the window was then maximized and the font enlarged.
- How to verify: the window shows a shell prompt
$. - If not seen: if
terminux-launchis not found, Terminux is not installed for your account. Stop and ask your administrator. Do not usesudo. - Note: whether the working directory is carried into Terminux has not been checked for a learner. Step 2 shows where you are.
- Video: 00:02.5; window at about 00:12.5.
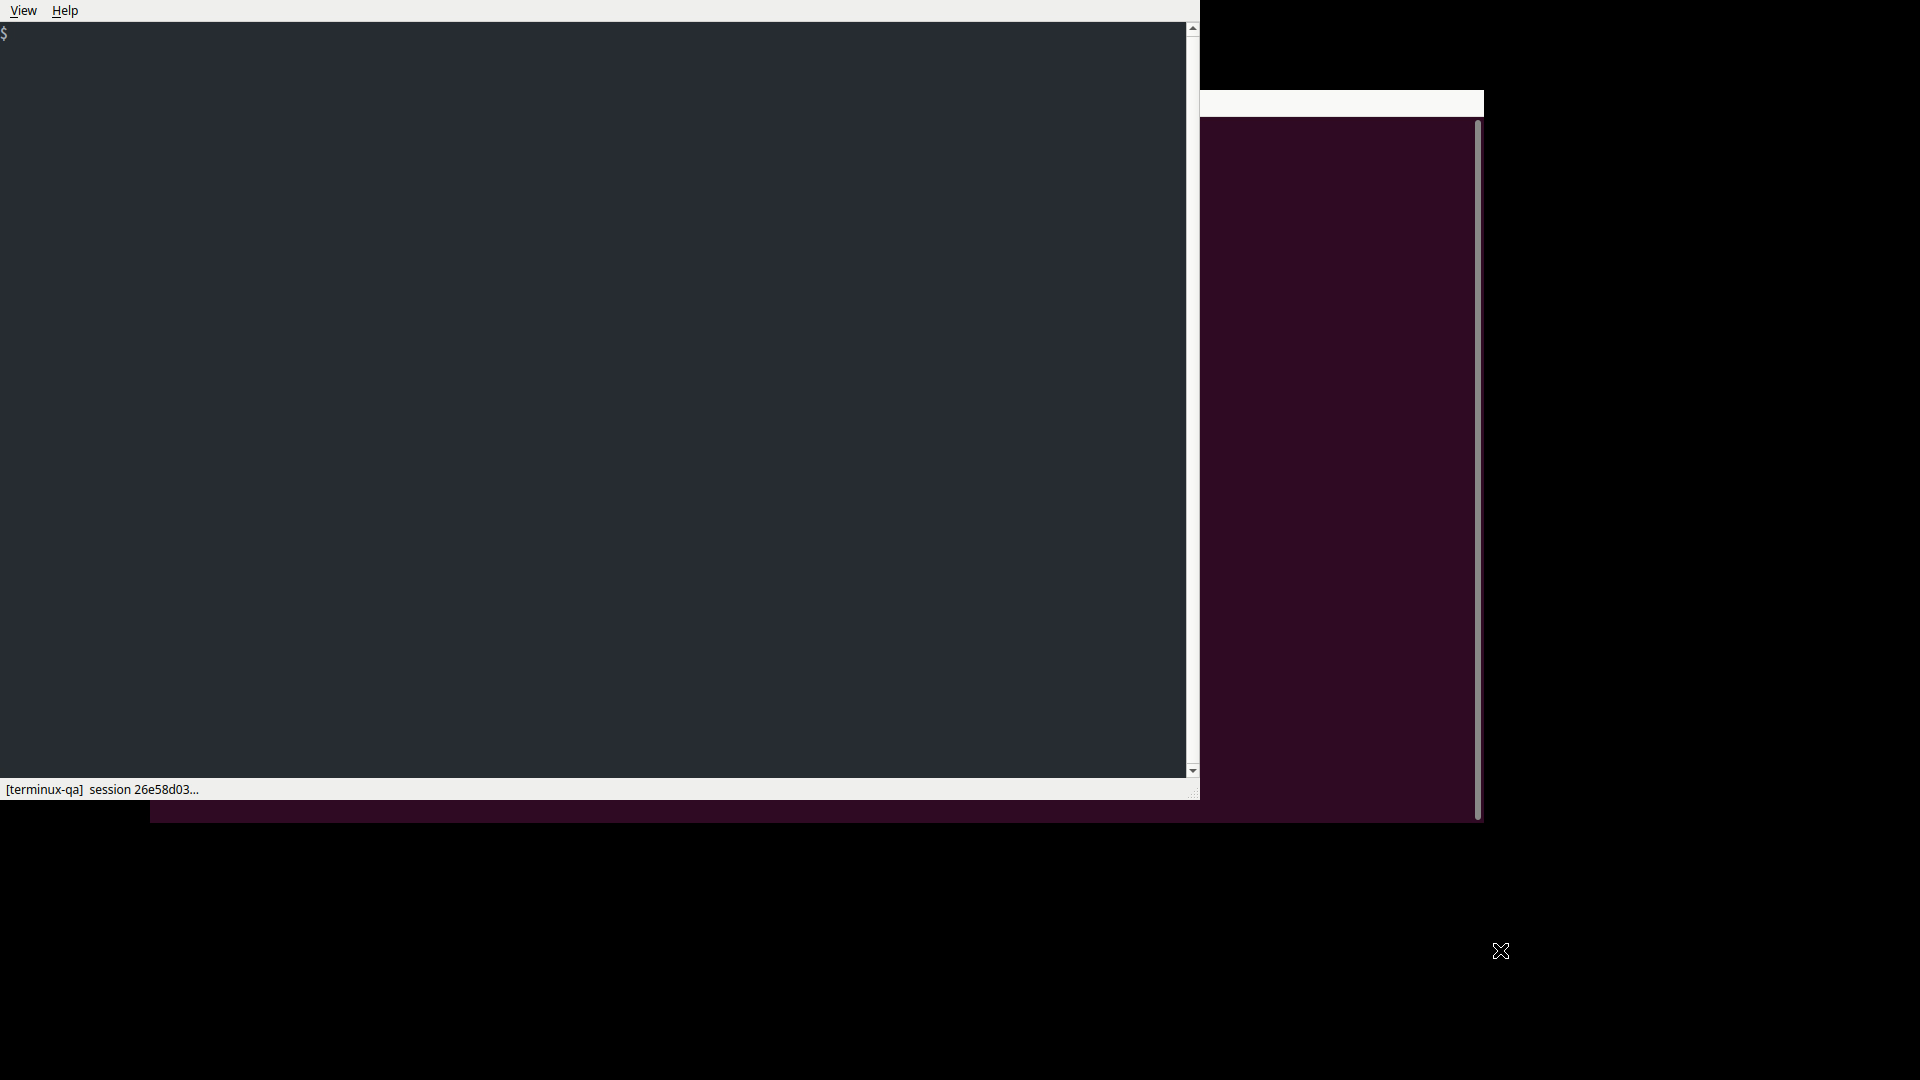
See also guide_frames/G01_launch_command.png.
Step 2: Use the shell exactly as always
- Purpose: Terminux is a terminal. Same commands, same habits.
- Where & prerequisites: the Terminux window.
- Action:
pwd ls - Observable result:
pwdprints your directory.lslists the ORFS flow contents. In the recording:BUILD Makefile README.md designs docs platforms scripts settings.mk test tutorials util - How to verify: you see
designsandplatforms, so you are in an ORFSflow/directory. - If not seen:
cdto yourflow/directory before you continue. - Video: 00:14.8–00:30.8. Brand cards at 00:30.8–00:48.9 [00:30.8–00:49.4].
- Screenshot:
guide_frames/G03_pwd_ls.png.
S02 · Q1: use @@ to find the design and its configuration
Separate session from here on (card at 01:35.9 [01:32.9]).
Step 3: Ask AI with @@
- Purpose: ask AI from the prompt without leaving the terminal.
- Where & prerequisites: the Terminux prompt. AI is enabled for your account.
- Action: type
@@directly followed by the question, then press Enter.@@I'm going to run the GCD design in ORFS using Nangate45. Where are its RTL and flow configuration, and how can I check them? - Observable result: the Notification Bar at the top of the terminal shows
Q: I'm going to run the GCD design…, then the answer. - How to verify: your question appears in the bar.
- If not seen: AI may not be enabled for your account. That is an administrator setting.
- Video: scene 01:39.4 [01:36.4]; typed 01:46.2 [01:43.2]; bar 01:47.6 [01:44.6].
- Screenshots:
guide_frames/G04_q1_typed.png,guide_frames/G05_q1_sent_panel.png.
Step 4: Read the answer
- Purpose: find out where to look.
- Observable result: the answer opens in the Notification Bar. Opening lines (verbatim):
In a standard ORFS checkout, run from the
flow/directory:- GCD RTL:
designs/src/gcd/gcd.v - GCD flow/design config:
designs/nangate45/gcd/config.mk - GCD timing constraints:
designs/nangate45/gcd/constraint.sdc
- GCD RTL:
- How to verify: Step 5 checks these paths against your files.
- If not seen: about 5 seconds after an answer arrives, the bar collapses to a header such as
4 notifications. Step 10 shows how to read it again. - Video: 01:50.1 [01:47.1]. The video skips part of the wait for the answer.
- Screenshot:
guide_frames/G06_q1_answer_expanded.png.
Step 5: Open the actual files yourself
- Purpose: the answer says where to look. You confirm it with the real files.
- Where & prerequisites: your ORFS
flow/directory. - Action:
Demo-environment path from the video; use your owncd /data/tut02/runtime/orfs/flowflow/path.
(The path is relative tols designs/src/gcd designs/nangate45/gcd head -n 20 designs/src/gcd/gcd.vflow/.) - Observable result:
designs/nangate45/gcdcontainsconfig.mkandconstraint.sdc.designs/src/gcdcontainsgcd.v.headshows the start of the RTL (module gcd).
- How to verify: the three paths from Step 4 exist.
- If not seen: your checkout differs from a standard one. Trust your files, not the answer.
- Video:
lsat about 02:02.8 [01:59.8]; theheadoutput is visible at about 02:03.1 [02:00.1] (the typing is not shown). - Screenshots:
guide_frames/G07_ls_design_dirs.png,guide_frames/G07b_head_gcd_v.png.
S03 · Q2: select text, choose Ask AI about this, then follow up with @@
Two different ways to ask AI:
- Select text, then right-click → Ask AI about this. The selected text itself is sent as the question. You cannot type an extra question in this menu.
- Type an
@@question. This is a separate, typed turn.
Step 6: Show the configuration and select one line
- Purpose: pick one real setting to ask about.
- Action:
Then, with the mouse, select the whole line that starts withcat designs/nangate45/gcd/config.mkexport SDC_FILE:export SDC_FILE = $(DESIGN_HOME)/$(PLATFORM)/$(DESIGN_NAME)/constraint.sdccatdoes not print line numbers. In this file it is the 5th line, afterexport DESIGN_NAME,export PLATFORM, an empty line andexport VERILOG_FILES. - Observable result: the line is highlighted. The highlight ends at the end of the text.
- How to verify: only that line is highlighted.
- Note: in the recording, the selection was made automatically. A mouse drag across one printed line selected it in the offline walkthrough (Step 14). Whether a double- or triple-click selects a whole line is unverified.
- Video: 02:03.0 [02:00.0]; selected at about 02:16.4 [02:13.4].
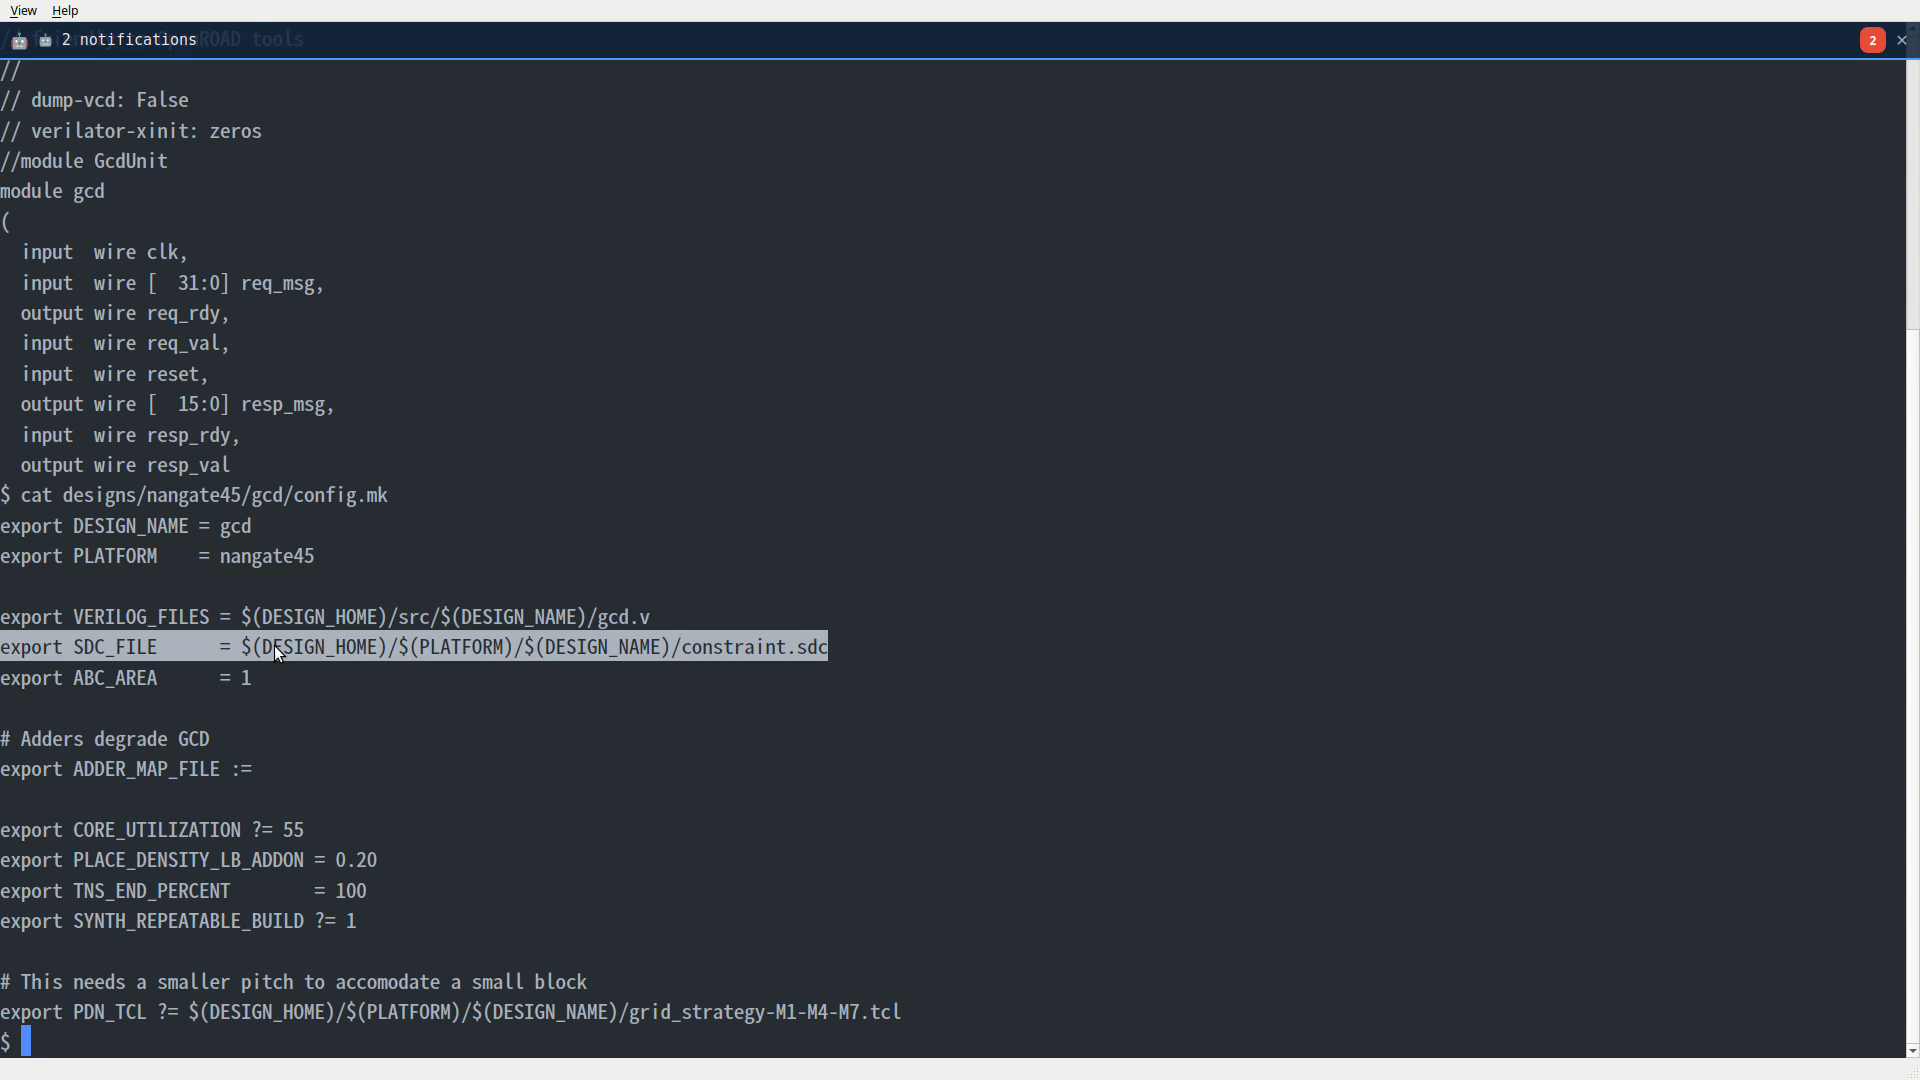
Step 7: Right-click → Ask AI about this
- Purpose: the selected text becomes your question; no retyping.
- Action: right-click inside the terminal. Choose Ask AI about this, the last item in the menu.
- Observable result: the Notification Bar shows the selected line as the question, then the answer. Verbatim excerpt:
This looks like a line from an ORFS
config.mk(or a platform/design config) that sets the SDC path. - How to verify: the question shown in the bar is your selected line.
- If not seen: if the menu item is greyed out, nothing is selected. Repeat Step 6.
- Video: menu at about 02:18.7 [02:15.7]; answer 02:21.2 [02:18.2].
- Screenshot:
guide_frames/G10_selection_answer.png.
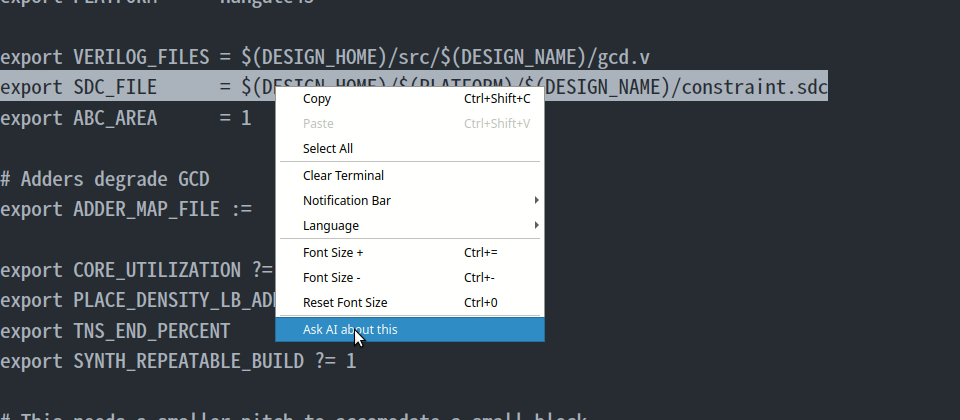
Step 8: Check the answer against the file
-
Purpose: the AI explained the line. You check the parts you can confirm yourself.
-
Real answer (verbatim excerpts):
With the usual GCD/Nangate45 settings (
DESIGN_HOME = ./designs,PLATFORM = nangate45,DESIGN_NAME = gcd) it expands to./designs/nangate45/gcd/constraint.sdc, i.e. the path I mentioned earlier.I can't verify your local checkout or branch from here
-
How to verify against the
catoutput from Step 6 (the video's check card shows the same items):- ✓ The line
export PLATFORM = nangate45is in the file (2nd line). - ✓ The line
export DESIGN_NAME = gcdis in the file (1st line). - ⓘ
DESIGN_HOMEis not set in this file. The AI assumed the usual./designs. - ✓
constraint.sdcis listed indesigns/nangate45/gcd/(Step 5).
- ✓ The line
-
Scope: this checks the
SDC_FILEpath reference only. It does not check the clock period, WNS, or timing signoff. -
Video: check card at 02:40.1 [02:37.1].
Step 9: Follow up with @@
- Purpose: continue the same conversation with a typed question.
- Action:
@@How could this timing setting affect the results we inspect after the GCD flow? - Observable result: a new answer in the Notification Bar. It begins (verbatim):
No orchestration run ID came with this question, so there's no recorded evidence bundle for me to query — the following is how
SDC_FILEbehaves in ORFS generally, and what to re-check in the reports afterwards. - How to verify:
- The question says only "this timing setting"; it does not name
SDC_FILE. The answer explains howSDC_FILEbehaves in ORFS. You can see in the reply that the AI followed the earlier conversation. - The answer also says no Run ID came with the question. That is correct: no run has been bound at this point. Binding comes in Step 14.
- The question says only "this timing setting"; it does not name
- If not seen: if the answer does not mention
SDC_FILE, the follow-up was not connected to Step 7. Check that you asked in the same Terminux window. - Video: typed 02:58.1 [02:55.1]; answer at about 03:06.9 [03:03.9].
- Screenshots:
guide_frames/G11_followup_typed.png,guide_frames/G12_followup_answer.png.
Step 10: Read a collapsed answer again (Notification Bar)
- Purpose: answers do not stay open. You need this for long answers, such as Q3 and Q4.
- Observable result: about 5 seconds after an answer arrives, with the pointer elsewhere, the bar collapses to a header such as
4 notifications. - Action:
- Open the bar: click the header text (for example
4 notifications), or right-click in the terminal and choose Notification Bar ▸ Show. - Keep it open: keep the pointer over the bar. It stays open; when the pointer leaves, it collapses after about 5 seconds.
- Scroll: turn the mouse wheel over the bar to move between messages. The header line always shows the newest message; the list below it may open at the newest message or at an earlier one.
- Make it taller (optional): drag the bar's bottom edge down. A resized bar stays open, and it covers the top lines of the terminal.
- Close it: click the header. Right after resizing, the first click may be ignored; click again.
- Default height: double-click the bottom edge.
- Open the bar: click the header text (for example
- How to verify: you can read the start of the answer, not only its last lines.
- Tested: with local notifications only.
- Each action above was tested once in the offline walkthrough (Frozen build, no AI request), using short local notifications (
RUN_BOUND, DQE Viewer launch confirmations). - Reading one long AI answer, such as Q3 or Q4, was not tested this way.
- Each action above was tested once in the offline walkthrough (Frozen build, no AI request), using short local notifications (
- Video: collapsed header at 03:00.4 [02:57.4].
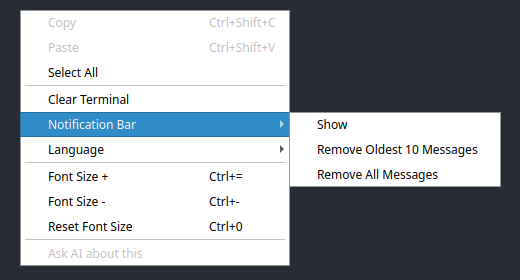
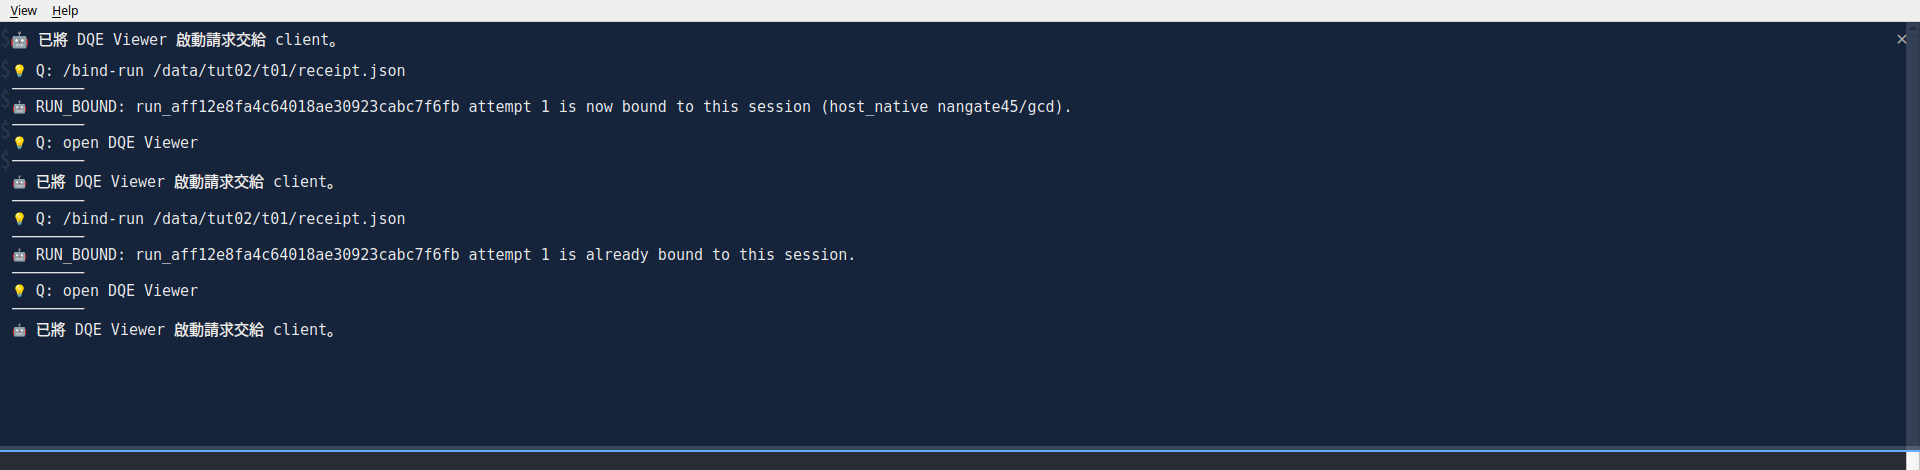
See also guide_frames/G13_collapsed_bar_header.png and derived_frames/DW02_collapsed_header_crop.png.
S04 · Run GCD from the terminal
New session (opening card at 03:31.0 [03:28.0]). The video shows S04–S07 from separate recordings of the same run. When you follow along, do S04–S07 in one Terminux window and keep it open. The variables you set in Steps 11–12 exist only in that window's shell.
Step 11: Prepare an empty output directory (not shown in the video)
- Purpose: each run writes its receipt and output into a directory you choose. The receipt identifies this run in every later step.
- Where & prerequisites: the Terminux window you will use for S04–S07. You may write to the parent directory.
- Action:
Template for your machine.export TAKE_DIR=/absolute/path/to/a/new/empty/directory mkdir -p "$TAKE_DIR" test -d "$TAKE_DIR" && test -w "$TAKE_DIR" && [ -z "$(ls -A "$TAKE_DIR")" ] && echo TAKE_READY - Observable result:
TAKE_READY. - How to verify: the check prints
TAKE_READYonly if the directory exists, is writable, and is empty. - If not seen: use a new directory. The run replaces an existing
receipt.jsonandstdout.txtwithout warning, so never reuse one. - If you close the window:
TAKE_DIRis gone. Open a new Terminux window and run theexport TAKE_DIR=…line again with the same path, but notmkdirand the check, because the directory is no longer empty. - Recording: the administrator prepared
/data/tut02/t01off camera.
Step 12: Start the flow
- Purpose: run ORFS from Terminux exactly as from any terminal. Terminux records the run and its quality evidence.
- Where & prerequisites: the same Terminux window as Step 11; ORFS, OpenROAD, Yosys, and KLayout available.
- Remember the stage:
--yosys-exeis Synthesis (Genus / Design Compiler role);--openroad-exeis Physical Implementation (Innovus / IC Compiler II role). The command runs the integrated ORFS flow, not two independent tutorial steps. - Action, as typed in the recording (9 lines):
As typed in the video.terminux-orfs-run \ --orfs-repo-root /data/tut02/runtime/orfs \ --openroad-exe /data/tut02/runtime/tools/openroad/bin/openroad \ --yosys-exe /data/tut02/runtime/tools/yosys/install/bin/yosys \ --design gcd --platform nangate45 --variant tut02 \ --design-config designs/nangate45/gcd/config.mk \ --work-home /data/tut02/t01/work \ --ledger-db /data/tut02/t01/ledger.sqlite \ --receipt-out /data/tut02/t01/receipt.json > /data/tut02/t01/stdout.txt/data/tut02/…is this video's demo environment; replace it with your own ORFS / tool installation paths. - Action for your machine (same window, after Step 11):
Template for your machine (not typed in the video).export ORFS_ROOT=/absolute/path/to/your/OpenROAD-flow-scripts export OPENROAD_EXE=/absolute/path/to/openroad export YOSYS_EXE=/absolute/path/to/yosys terminux-orfs-run \ --orfs-repo-root "$ORFS_ROOT" \ --openroad-exe "$OPENROAD_EXE" \ --yosys-exe "$YOSYS_EXE" \ --design gcd --platform nangate45 --variant tut02 \ --design-config designs/nangate45/gcd/config.mk \ --work-home "$TAKE_DIR/work" \ --ledger-db "$TAKE_DIR/ledger.sqlite" \ --receipt-out "$TAKE_DIR/receipt.json" > "$TAKE_DIR/stdout.txt"--design-configis relative toflow/(the CLI help text).- Only standard output goes to
stdout.txt. Errors still appear on screen.
- Observable result: the screen stays empty while the flow runs, then the prompt returns. In the recording the run took about 48 s; the video skips about 45 s of this wait.
- How to verify: When the flow returns to the prompt, run no other shell command yet. Continue immediately to Step 13 and check the flow's exit code with
echo $?. Only then inspectreceipt.jsonandstdout.txt. - If not seen: error text on screen means the run did not start or did not finish. Keep it, and check paths and executables. Do not reuse the directory for a new attempt (Step 11).
- Video: S04 at 03:35.0 [03:32.0]; command complete at about 04:07.4 [04:04.4]; prompt back at 04:07.6 [04:04.6].
- Screenshots:
guide_frames/G14_s04_command_typed.png,guide_frames/G15_s04_prompt_returned.png.
S05 · Check the result yourself
Two facts to keep apart
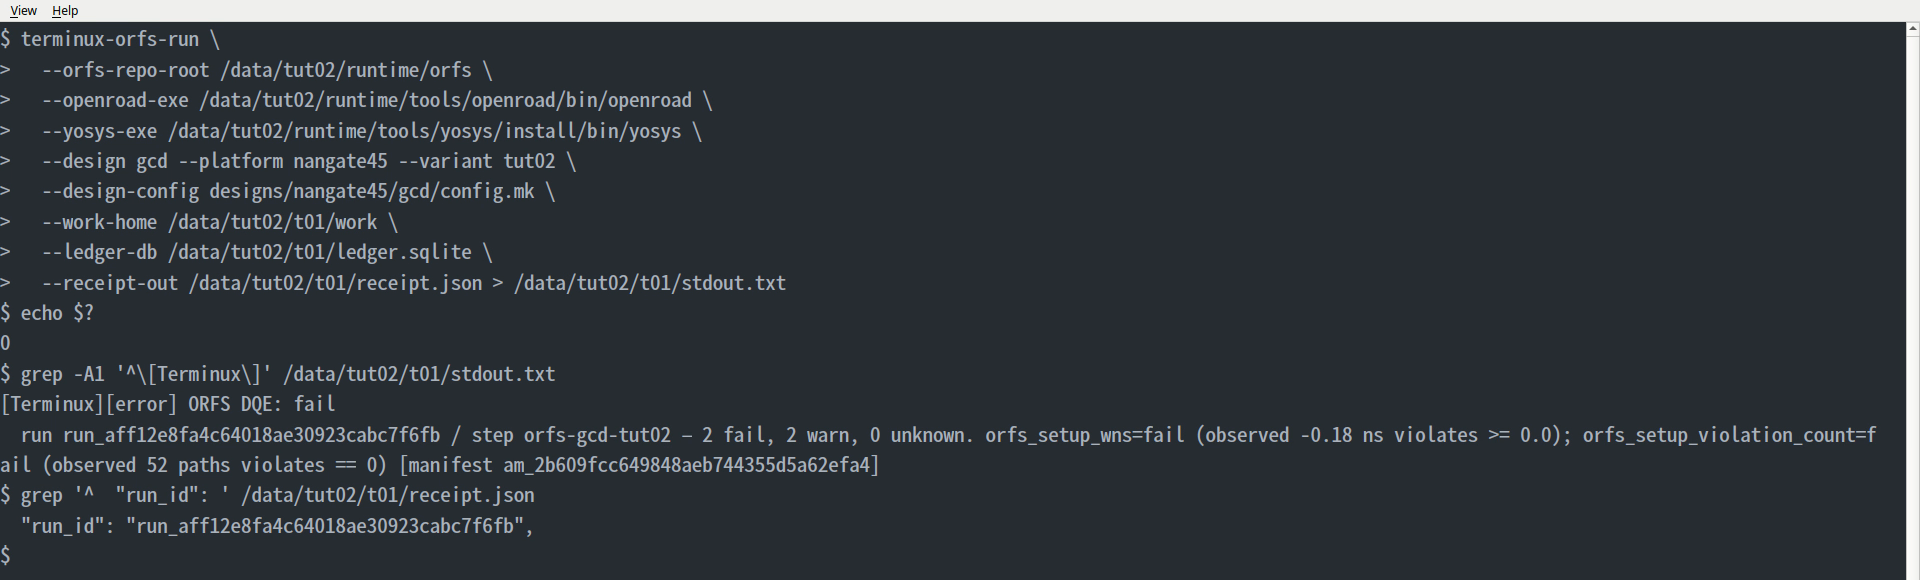
You see It means echo $?→0The flow process finished. [Terminux][error] ORFS DQE: failThe design-quality checks (DQE) need attention. The overall DQE result is FAIL. Viewer: 2 Fail, 2 Warn The same 4 rows that the AI calls 2 ERRORand 2WARNING. The Viewer and the terminal summary say fail; the AI quotes the DQE levelERROR.-0.18 ns(Viewer, terminal summary, AI)The orfs_setup_wnsDQE value, rounded to 2 decimals.-0.1806(Report)The exact finish critical path slackvalue printed by the Report.The AI does not read the Report. It reads a summary of this run's evidence through a read-only Evidence Tool (Step 15), so you check the timing numbers yourself in the Viewer and the Report.
Step 13: Exit code, DQE summary, Run ID
-
Purpose: before asking AI, find out yourself whether the flow finished, what the quality checks say, and which run this is.
-
Where & prerequisites: the same Terminux window, right after Step 12.
echo $?must be the first command after the run. -
Action, as typed:
echo $?
grep -A1 '^\[Terminux\]' /data/tut02/t01/stdout.txt
grep '^  "run_id": ' /data/tut02/t01/receipt.json
As typed in the video.
/data/tut02/…is this video's demo environment; replace it with your own ORFS / tool installation paths. -
Action for your machine:
echo $?
grep -A1 '^\[Terminux\]' "$TAKE_DIR/stdout.txt"
grep '^  "run_id": ' "$TAKE_DIR/receipt.json"
grep '^  "attempt": ' "$TAKE_DIR/receipt.json"
Template for your machine. The last line is extra and was not typed in the video.
-
Observable result (recording):
0 [Terminux][error] ORFS DQE: fail run run_aff12e8fa4c64018ae30923cabc7f6fb / step orfs-gcd-tut02 — 2 fail, 2 warn, 0 unknown. orfs_setup_wns=fail (observed -0.18 ns violates >= 0.0); orfs_setup_violation_count=fail (observed 52 paths violates == 0) [manifest am_2b609fcc649848aeb744355d5a62efa4] "run_id": "run_aff12e8fa4c64018ae30923cabc7f6fb", -
How to verify:
- Exit
0andDQE: failare two different facts (see the box above). - Write down the Run ID, the attempt, and the
am_…manifest ID at the end of the summary line. You need them in Steps 14, 16 and 18. - Not shown in this recording: when all checks pass, the header reads
[Terminux][warning] ORFS DQE: pass. This run failed, so the recording shows onlyerror … fail.
- Exit
-
Where these identifiers come from:
Item Source Receipt The file you named with --receipt-out. The CLI does not print this path.Run ID The receipt's top-level "run_id". It also appears in the DQE summary line.Attempt The receipt's top-level "attempt"(here1). Step 14 also shows it inRUN_BOUND. In the recording, the administrator checked it off camera. -
If not seen:
- If
grep -A1prints nothing, the run produced no DQE notice. Record that. - If the receipt is missing, the run did not finish. Go back to Step 12.
- If
-
Video: S05 at 04:07.6 [04:04.6]; all three outputs by about 04:31.6 [04:28.6]. Tutorial Note at 04:26.3 [04:23.3]: exit 0 = the flow finished · DQE: fail = quality checks need attention.
S06 · Bind the run, ask AI, then verify in the Viewer and the Report
Same Run · New Session (card at 04:33.6 [04:30.6]). In the video, Steps 14, 15 and 19 come from a new Terminux session that bound the same run again. When you follow along, stay in your one window.
Step 14: Bind the run
- Purpose: tell Terminux which run your questions are about.
- Where & prerequisites: the same Terminux window. You need the receipt's full absolute path.
- Action, as typed:
As typed in the video (demo-environment path). For your run, first print the path in the shell:@@/bind-run /data/tut02/t01/receipt.json
Template for your machine. Then:echo "$TAKE_DIR/receipt.json"- Select the printed path with the mouse (drag across it).
- Press Ctrl+Shift+C to copy it.
- Type
@@/bind-run(with one space at the end). - Press Ctrl+Shift+V to paste.
- Press Enter.
- Observable result: the Notification Bar shows
RUN_BOUND: run_aff12e8fa4c64018ae30923cabc7f6fb attempt 1 is now bound to this session (host_native nangate45/gcd).If the run is already bound in this window, it says… is already bound to this session. - How to verify: the Run ID and attempt match Step 13.
- If not seen:
- An error usually means the path is not absolute, or it is not the receipt from Step 12.
- Do not type
@@/bind-run $TAKE_DIR/receipt.json. Terminux sends$TAKE_DIRliterally, and the bar showsQ: /bind-run $TAKE_DIR/receipt.json.
- Walkthrough: the five-step copy and paste was tested in the offline walkthrough. Terminux received the pasted command byte-for-byte equal to the typed one, and the typed
$TAKE_DIRform was sent unexpanded. - Video: bind at 04:37.1 [04:34.1];
RUN_BOUNDvisible at about 04:42.3 [04:39.3].


Step 15: Ask Q3: which DQE checks are WARN or FAIL?
-
Purpose: ask AI to look up this run's evidence and list the checks that need attention.
-
Where & prerequisites: the same window, after Step 14. Your build must pass the bound run to the AI (see What you need).
-
Action:
@@For the Run I just bound, which DQE checks are WARN or FAIL? Show the run evidence and where I can verify it. -
Observable result: the answer arrives in the Notification Bar. The bar first shows only its opening lines; use Step 10 to read all of it. The video shows the excerpts on a quote card. Verbatim excerpts:
DQE checks not OK — 4 of 14 rows. Two are WARNING-level and two are ERROR-level. Note: this package reports
ERRORrather than a literalFAILstatus, so nothing was tagged "FAIL" verbatim.DQE check Value Status orfs_log_warning_markers2 markers WARNING orfs_setup_tns−7.94 ns WARNING orfs_setup_violation_count52 paths ERROR orfs_setup_wns−0.18 ns ERROR So the flow completed but setup timing is not clean — negative WNS (−0.18 ns) and TNS (−7.94 ns) across 52 violating paths.
No report items were returned, so I cannot show you the underlying timing-report artifacts — only the DQE summary rows above.
-
How to verify: the AI used a read-only Evidence Tool on this run's DQE summary; it did not see the Report. Steps 16–18 check the same numbers in the Viewer and the Report.
-
If not seen: if the AI says it has no run ID for the bound run, your build does not pass the bound run to the AI. An earlier build behaved exactly like this; that is why S06–S07 in the video come from a new session with an updated build.
-
Video: Q3 typed by about 04:51.8 [04:48.8]; answer arrives 05:01.0 [04:58.0]; quote card 05:05.6 [05:02.6]. The card's Tutorial Note reads: Next, we'll inspect the DQE Viewer and verify the results in the Report.
-
Screenshots:
guide_frames/G18_s06_q3_typed.png,guide_frames/G19_s06_q3_answer_bar.png.
Step 16: Open the DQE Viewer
- Purpose: "Terminux also includes a small utility called DQE Viewer for reviewing design quality. Let's open it, see which checks need attention, and then verify the timing results in the report."
- Where & prerequisites: the same window. The DQE Viewer is installed with Terminux (see What you need).
- Action:
@@open DQE Viewer - Observable result:
- The Notification Bar briefly confirms the request. In the recording it reads
已將 DQE Viewer 啟動請求交給 client。(in Chinese even with the English setting). - Then the DQE Viewer window opens on the Temporary tab, with one job
20261103_204848_001(orfs_finish,2 FAIL). - Summary cards: TOTAL 14 · PASS 10 · WARN 2 · FAIL 2 · UNKNOWN 0.
- The Notification Bar briefly confirms the request. In the recording it reads
- How to verify:
- TOTAL 14 matches the AI's "4 of 14 rows" not OK.
- The Viewer shows a job key (
20261103_204848_001), not the Run ID, and it has no Run ID filter. - One job listed (as in the recording): it is your run's job. In the recording, every row of that job belongs to
run_aff12e8fa4c64018ae30923cabc7f6fb, attempt 1 (checked against the DQE database off camera). - Several jobs listed: select a job in the left list, then click any row in its table. The Inspector's REFERENCE path ends with a manifest ID (
am_….json). Compare it with the[manifest am_…]you wrote down in Step 13. In the recording both aream_2b609fcc649848aeb744355d5a62efa4. If no job matches, or you are unsure, stop and ask your administrator to confirm which job is your run. Do not guess.
- If not seen:
- No window opens: the Viewer is probably not installed with Terminux. Ask your administrator.
- The
@@request is refused: this tutorial assumes Terminux AI is enabled for your account (What you need).
- Note: this command makes no AI request. The Viewer only reads the stored DQE results.
- Viewer language: follows the Terminux language (right-click the terminal → Language;
guide_frames/G25_language_menu_zh.png). The EN film shows English; the zh-TW film shows 繁體中文 after switching the language and reopening the Viewer. - Video: typed at 05:21.6 [05:18.6]; Viewer visible at 05:24.1 [05:21.1]. This part comes from a new session.
- Screenshots:
guide_frames/G20_viewer_open_typed_en.pngguide_frames/G21_viewer_overview_en.png- zh-TW:
guide_frames/G26_viewer_overview_zh.png
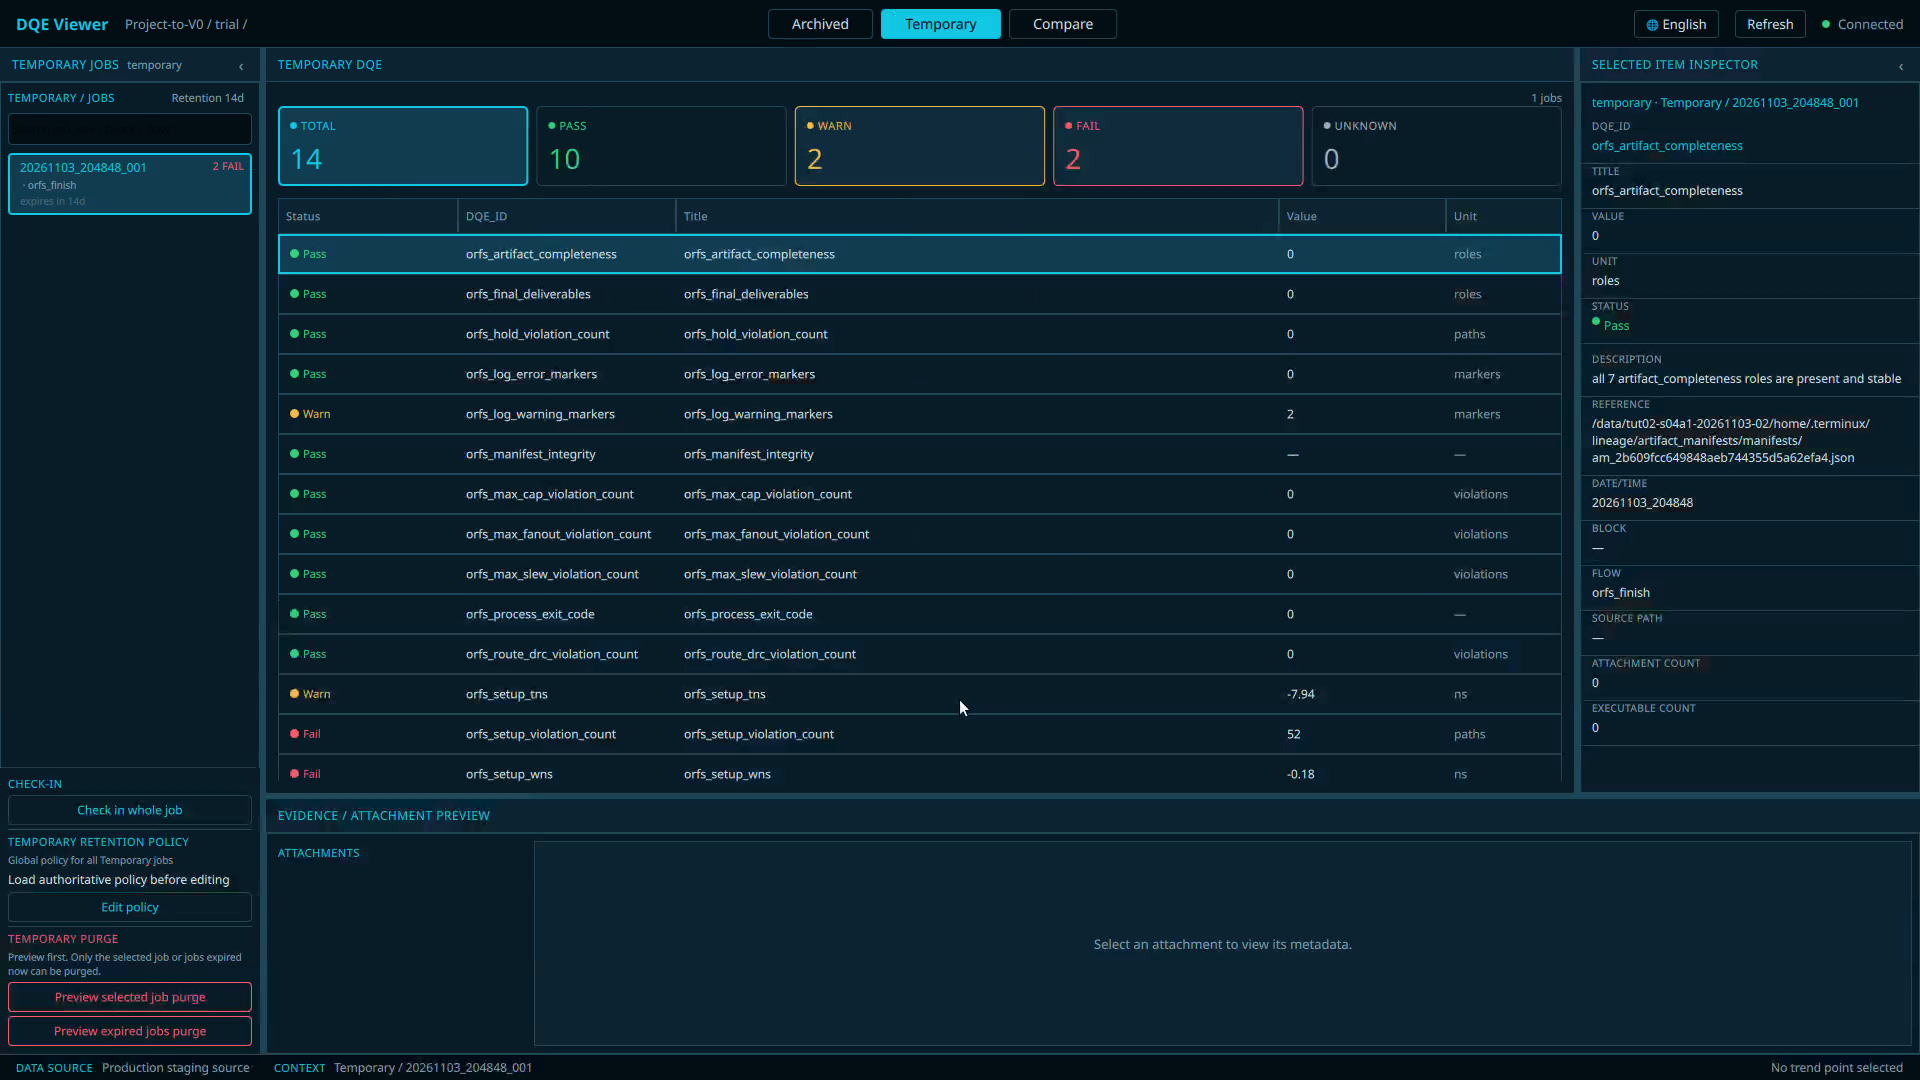
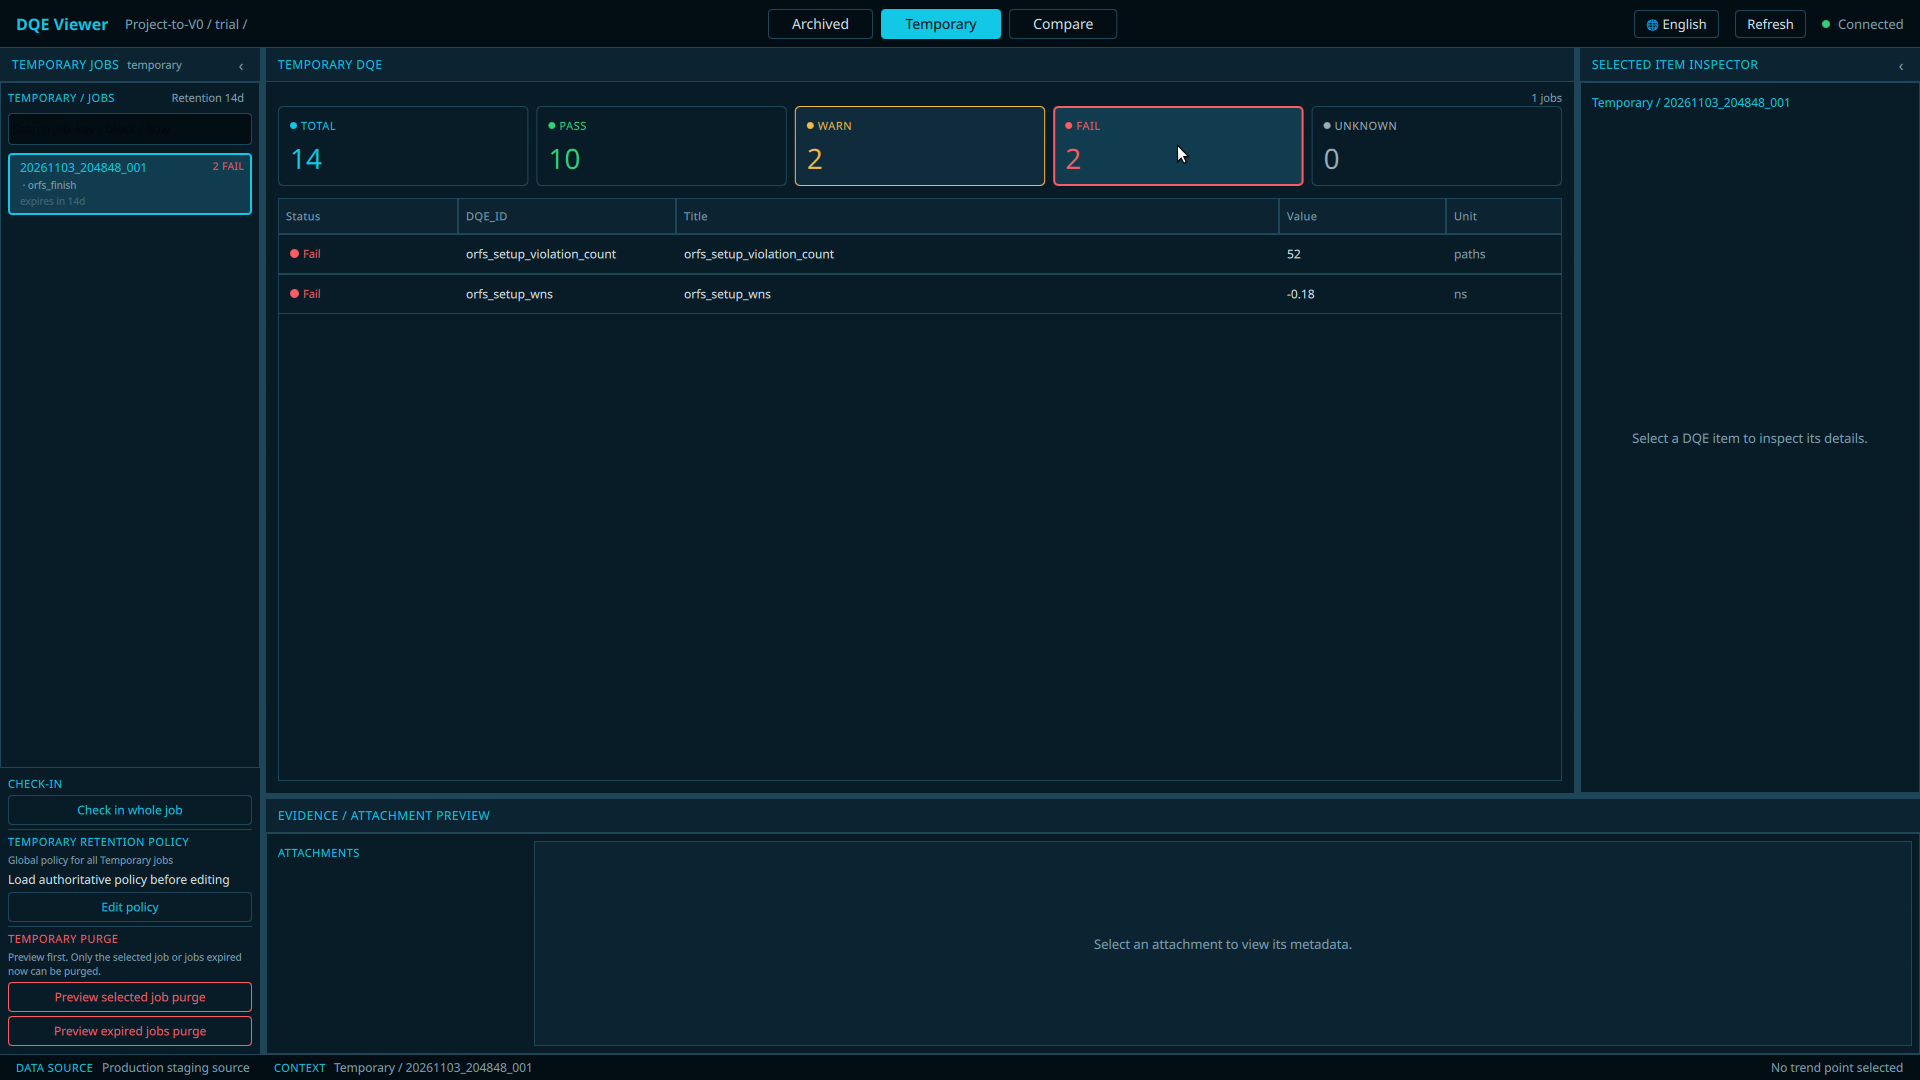
Step 17: Filter to FAIL and inspect the two checks
- Purpose: find the failing checks and read why each one fails.
- Where & prerequisites: the DQE Viewer from Step 16.
- Action:
- Click the FAIL summary card.
- Click the row
orfs_setup_wns. - Click the row
orfs_setup_violation_count.
- Observable result:
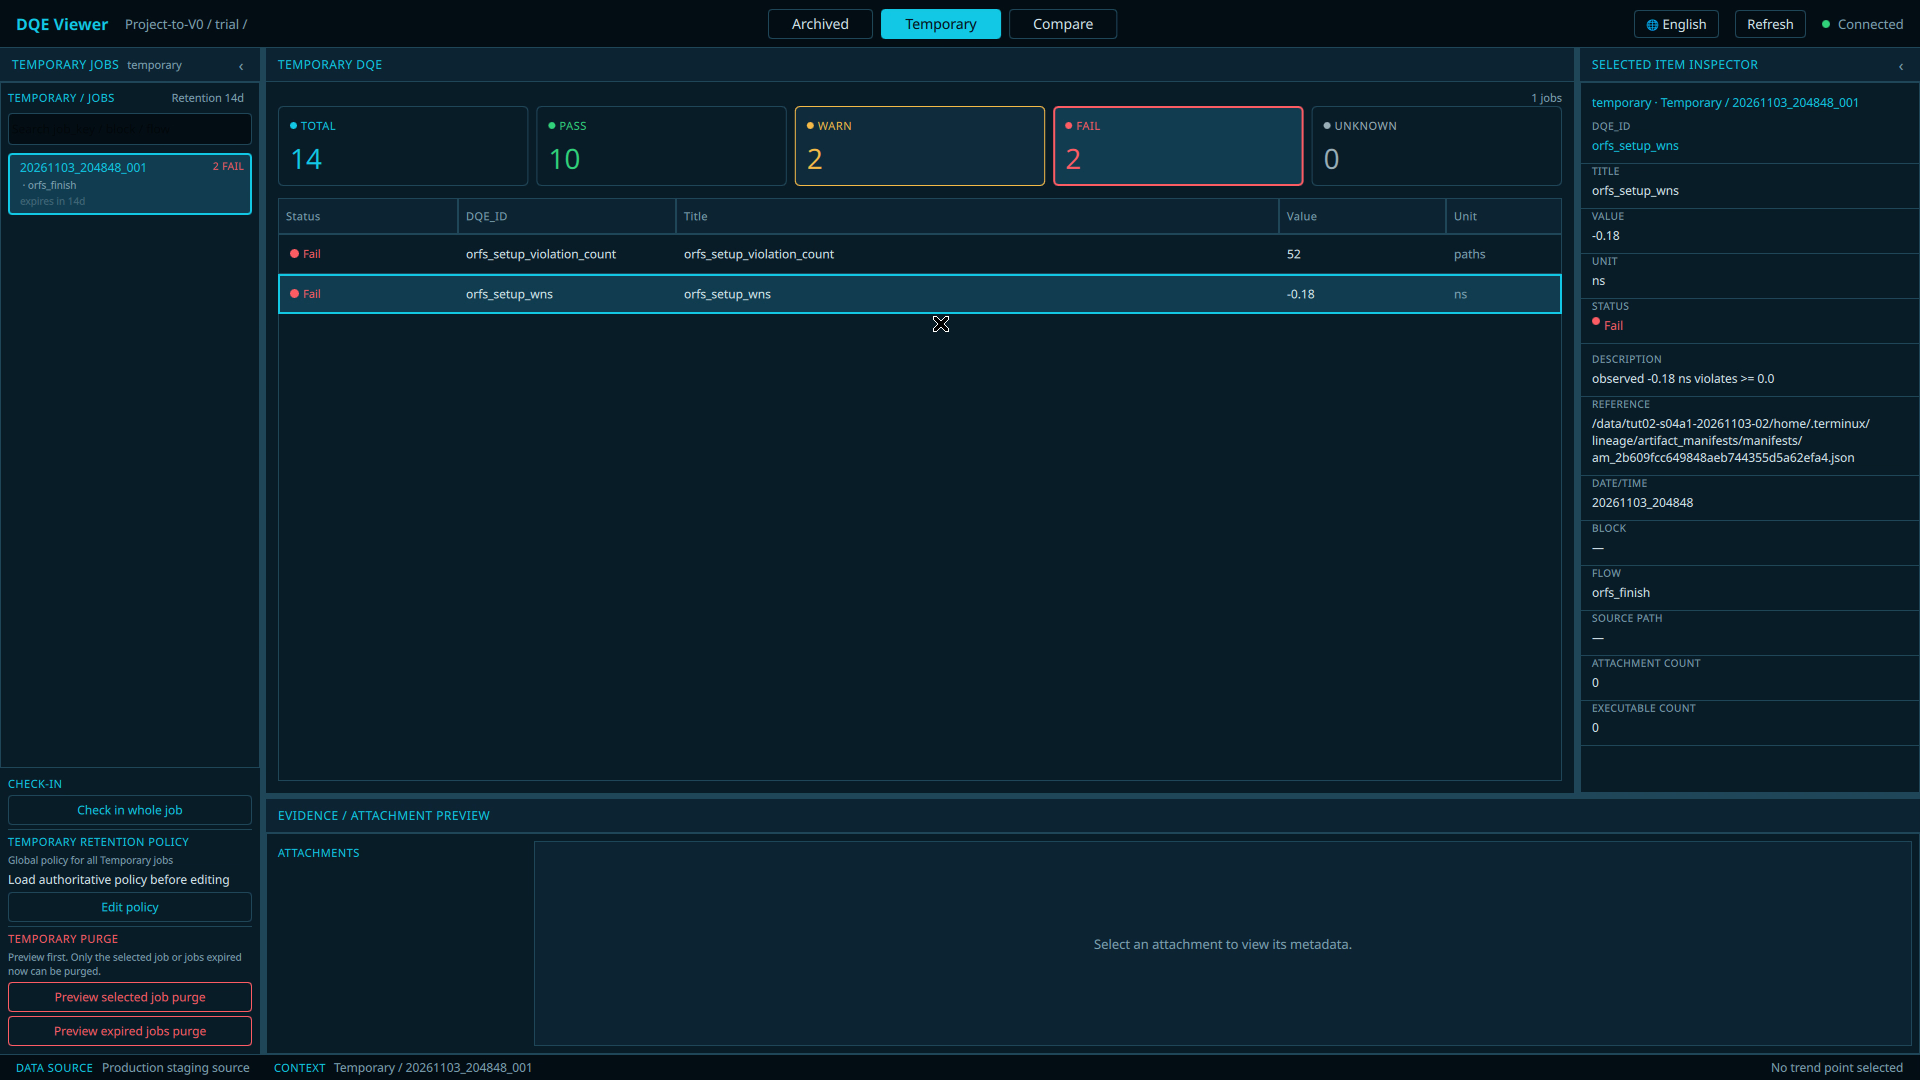
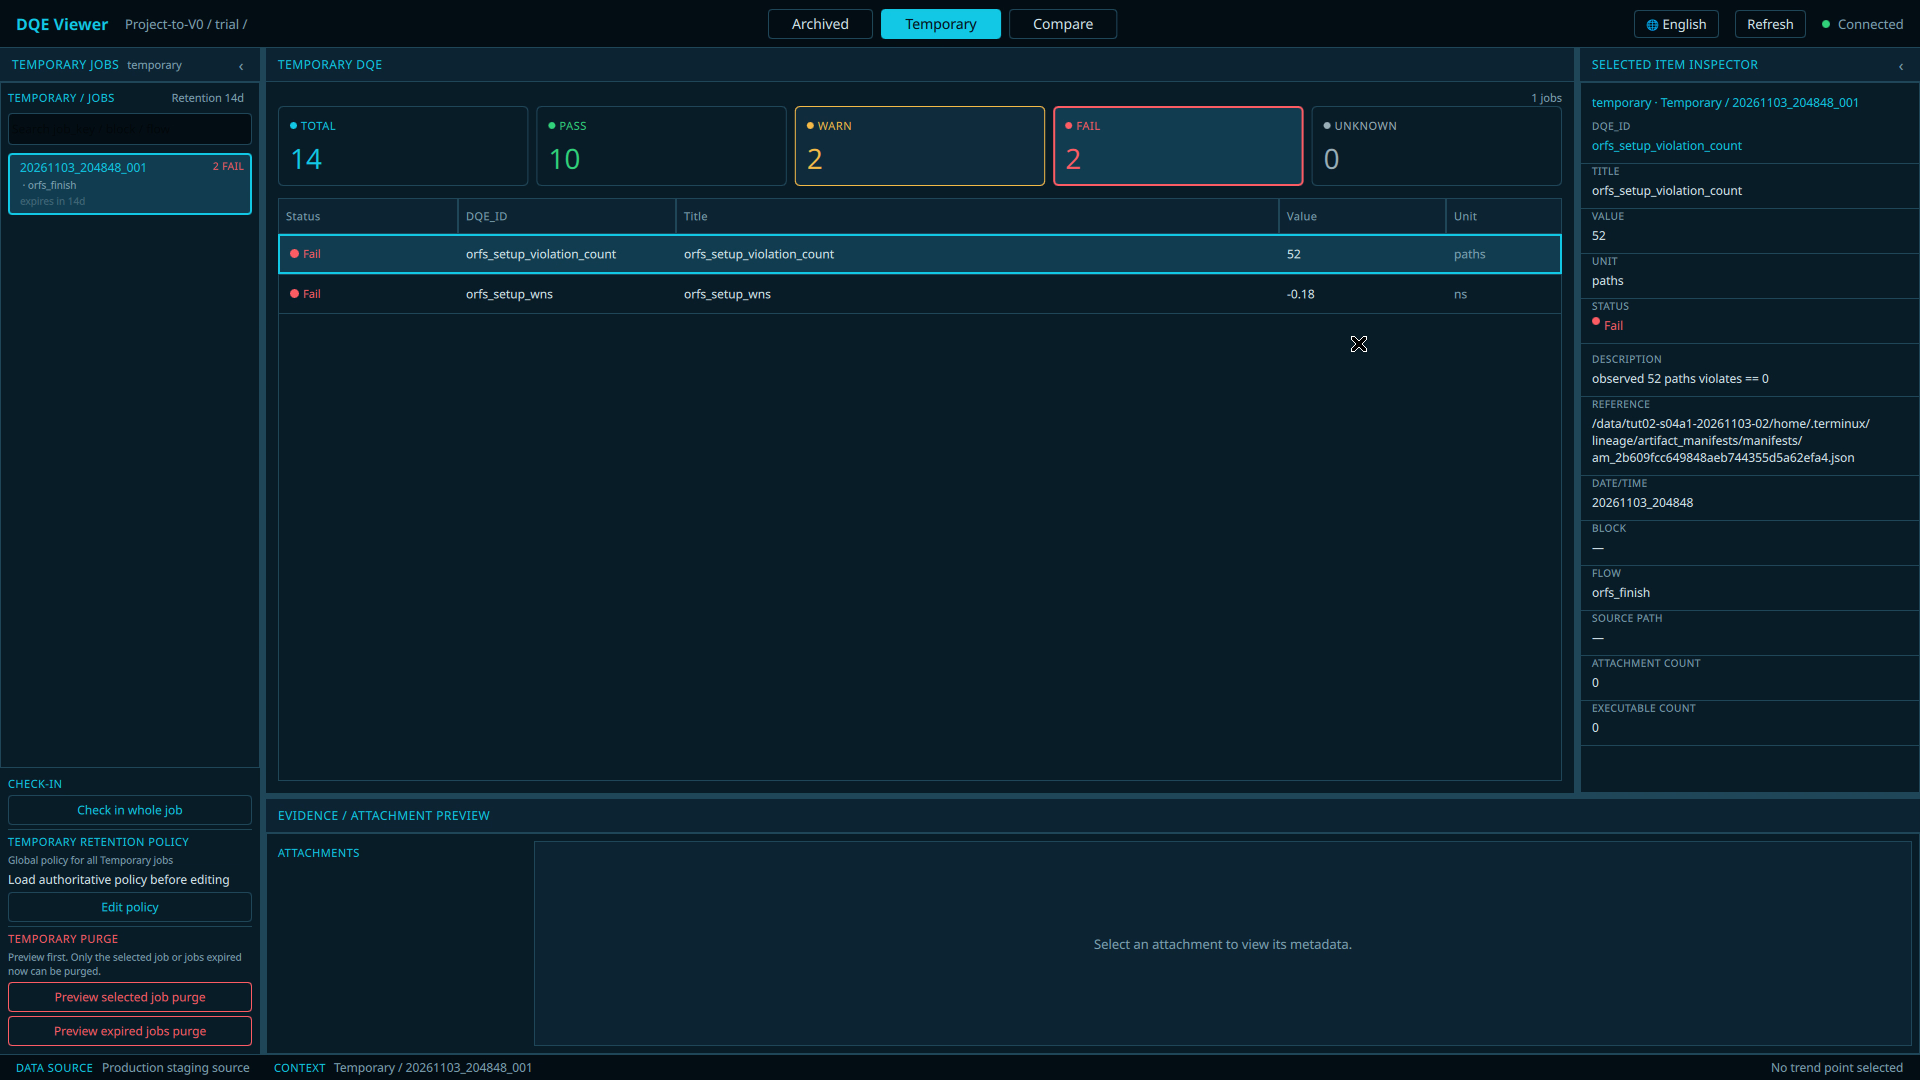
- After 1: the table shows only
orfs_setup_violation_count(52, paths) andorfs_setup_wns(-0.18, ns), both Fail. - After 2: the Selected Item Inspector (right) shows VALUE
-0.18, UNITns, STATUS Fail, DESCRIPTIONobserved -0.18 ns violates >= 0.0. - After 3: the Inspector shows VALUE
52, UNITpaths, DESCRIPTIONobserved 52 paths violates == 0.
- After 1: the table shows only
- How to verify:
- These are the two checks the AI called
ERRORin Step 15; the Viewer labels them Fail. - The two Warn rows (visible before filtering) are
orfs_setup_tns(-7.94 ns) andorfs_log_warning_markers(2 markers).
- These are the two checks the AI called
- If not seen: if the FAIL card shows 0, this job has no failing checks. Say so instead of looking for the two rows.
- Leave alone: the left panel's Check-in, Temporary retention policy and Temporary purge controls are not part of this tutorial. They change or remove stored DQE results.
- Video: FAIL filter at 05:31.8 [05:28.8];
orfs_setup_wnsat 05:37.6 [05:34.6];orfs_setup_violation_countat 05:48.3 [05:45.3]. - Screenshots:
guide_frames/G22_viewer_fail_filter_en.pngguide_frames/G23_viewer_wns_inspector_en.pngguide_frames/G24_viewer_violation_inspector_en.png- zh-TW:
G27_viewer_fail_filter_zh.png,G28_viewer_wns_inspector_zh.png,G29_viewer_violation_inspector_zh.png
Step 18: Verify the timing in the Report
- Purpose: read the exact setup slack from the run's Report.
- Where & prerequisites: the same Terminux window. The Run ID and attempt come from Step 13.
- Action, as typed in the recording:
As typed in the video.terminux-orfs-report --receipt /data/tut02/t01/receipt.json --run-id run_aff12e8fa4c64018ae30923cabc7f6fb --attempt 1/data/tut02/…is this video's demo environment; replace it with your own ORFS / tool installation paths. - Action for your machine:
Template for your machine. Before you run it, replace the two values in quotes with theRUN_ID="run_aff12e8fa4c64018ae30923cabc7f6fb" ATTEMPT="1" echo "Run ID: $RUN_ID attempt: $ATTEMPT" terminux-orfs-report --receipt "$TAKE_DIR/receipt.json" --run-id "$RUN_ID" --attempt "$ATTEMPT"run_idandattemptprinted by your Step 13. The values shown are the recording's. Keep the quotes. - Observable result: the
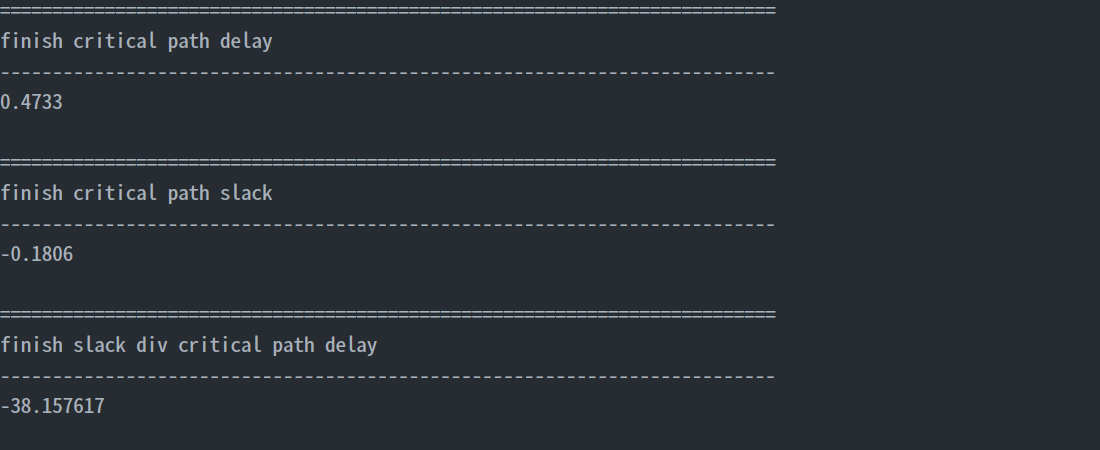
echoline prints your values. The Report then prints sections such asfinish critical path delayandfinish critical path slack. In the recording, the slack value is-0.1806. - How to verify:
-0.1806agrees with the DQE WNS of-0.18 ns(Viewer, AI, terminal summary), which is rounded.- Quote the Report value as
-0.1806and the DQE value as-0.18 ns; they are not the same number.
- If not seen: if the
echoline still shows the recording's values, or values that differ from Step 13, fix them before running the Report. - Note: the command itself is the one typed in the recording; the variable form above has not been run by a learner.
- Video: 05:53.1 [05:50.1]. The value is highlighted with the note The Report shows the worst setup slack: −0.1806 ns (the AI reported ≈ −0.18 ns). The output shown is at about 06:06.5 [06:03.5].
S07 · Ask what to inspect next
Step 19: Ask Q4
-
Purpose: ask AI what to inspect next, based on this run's evidence.
-
Where & prerequisites: the bound window (Step 14). The video uses this wording, which asks only about the bound run.
-
Action:
@@Based on the evidence from this run, what should I inspect next, and why? -
Observable result: a long answer arrives in the Notification Bar; use Step 10 to read all of it. Verbatim excerpts:
1. The setup-timing report for step
orfs-gcd-tut02— highest value. This is the only place something is actually wrong with the design result rather than the process. WNS −0.18 ns, TNS −7.94 ns, 52 violating paths.Hold = 0, route DRC = 0, max cap/fanout/slew = 0. Spending time on routing DRC or hold closure this run would be redundant — setup timing is the single open front.
If this design is heading for sign-off, it's worth confirming whether DQE
ERRORis advisory or gating at this step. -
How to verify:
- Hold, route DRC and max cap/fanout/slew are Pass rows in the Viewer (Step 16, before filtering).
- The AI's suggestion tells you what to inspect next. It is not a timing signoff.
-
If not seen: see Step 15.
-
Video: scene at 06:07.7 [06:04.7]; Q4 typed by about 06:22.9 [06:19.9]; answer arrives 06:38.9 [06:35.9]; quote card at 06:43.2 [06:40.2].
-
Screenshots:
guide_frames/G31_s07_q4_typed.png,guide_frames/G32_s07_q4_answer_bar.png.
Step 20: What you have done
- Video: closing card at 06:59.2 [06:56.2]:
- Flow completed · Quality checks need attention
- DQE: 2 ERROR · 2 WARNING · WNS −0.18 ns · 52 setup violations
- Next: inspect the setup-timing report
- Recap:
- You found the inputs (S02–S03).
- You ran the flow and identified the run (S04–S05).
- You asked AI about the evidence and checked it in the Viewer and the Report (S06).
- You know what to look at next (S07).
- A completed flow is a milestone. The quality checks tell you what still needs work.
Appendix · Prerequisite status
| Prerequisite | Status |
|---|---|
Terminux installed; terminux-launch, terminux-orfs-run, terminux-orfs-report on PATH |
Confirm the required tools and Profile configuration before proceeding. |
DQE Viewer (dqe_viewer next to terminux) and its Qt Quick runtime in the installation |
The QA package used for filming lacked the Viewer; it was added from the same build. |
| ORFS checkout, OpenROAD, Yosys, KLayout for GDS finishing | The ORFS flow must use a compatible KLayout executable. The example uses KLayout 0.28.16. |
| Terminux AI enabled (named Profile with run binding) | Administrator task. |
| Build that passes the bound run to the AI | S06–S07 require a version and Profile configuration that can pass the bound Run to AI. Confirm this capability before proceeding. |
The S04–S07 session does not continue the S02–S03 conversation; the AI in S06–S07 did not see S01–S05.
- Paths under
/data/tut02/…and the Viewer Inspector's REFERENCE field in the video and screenshots are the recording's demo environment; yours will differ.